Efficiently managing Liquefied Natural Gas (LNG) vessel scheduling is critical for maintaining the supply chain’s integrity and meeting market demands.
Efficiently managing Liquefied Natural Gas (LNG) vessel scheduling is critical for maintaining the supply chain’s integrity and meeting market demands. Given the complex nature of LNG logistics, where voyage durations and port processing delays can vary significantly, it’s essential to use advanced modelling techniques to predict and optimise LNG vessel scheduling.
One such technique is Monte Carlo simulation, which allows for a detailed analysis of different variables and their impacts on the scheduling process. This paper describes how Monte Carlo can be applied to vessel scheduling and presents an example simulation.
Monte Carlo Methods
Monte Carlo methods are a broad class of computational algorithms that rely on repeated random sampling to obtain numerical results. They are, essentially, random experimentations providing approximate solutions to problems that are otherwise intractable or too complex to analyse mathematically. Monte Carlo methods vary, but tend to follow a particular pattern:
- Define a domain of possible inputs
- Generate inputs randomly from a probability distribution over the domain
- Perform a deterministic computation of the outputs
- Aggregate the results
Practical Implementation of Monte Carlo Simulation
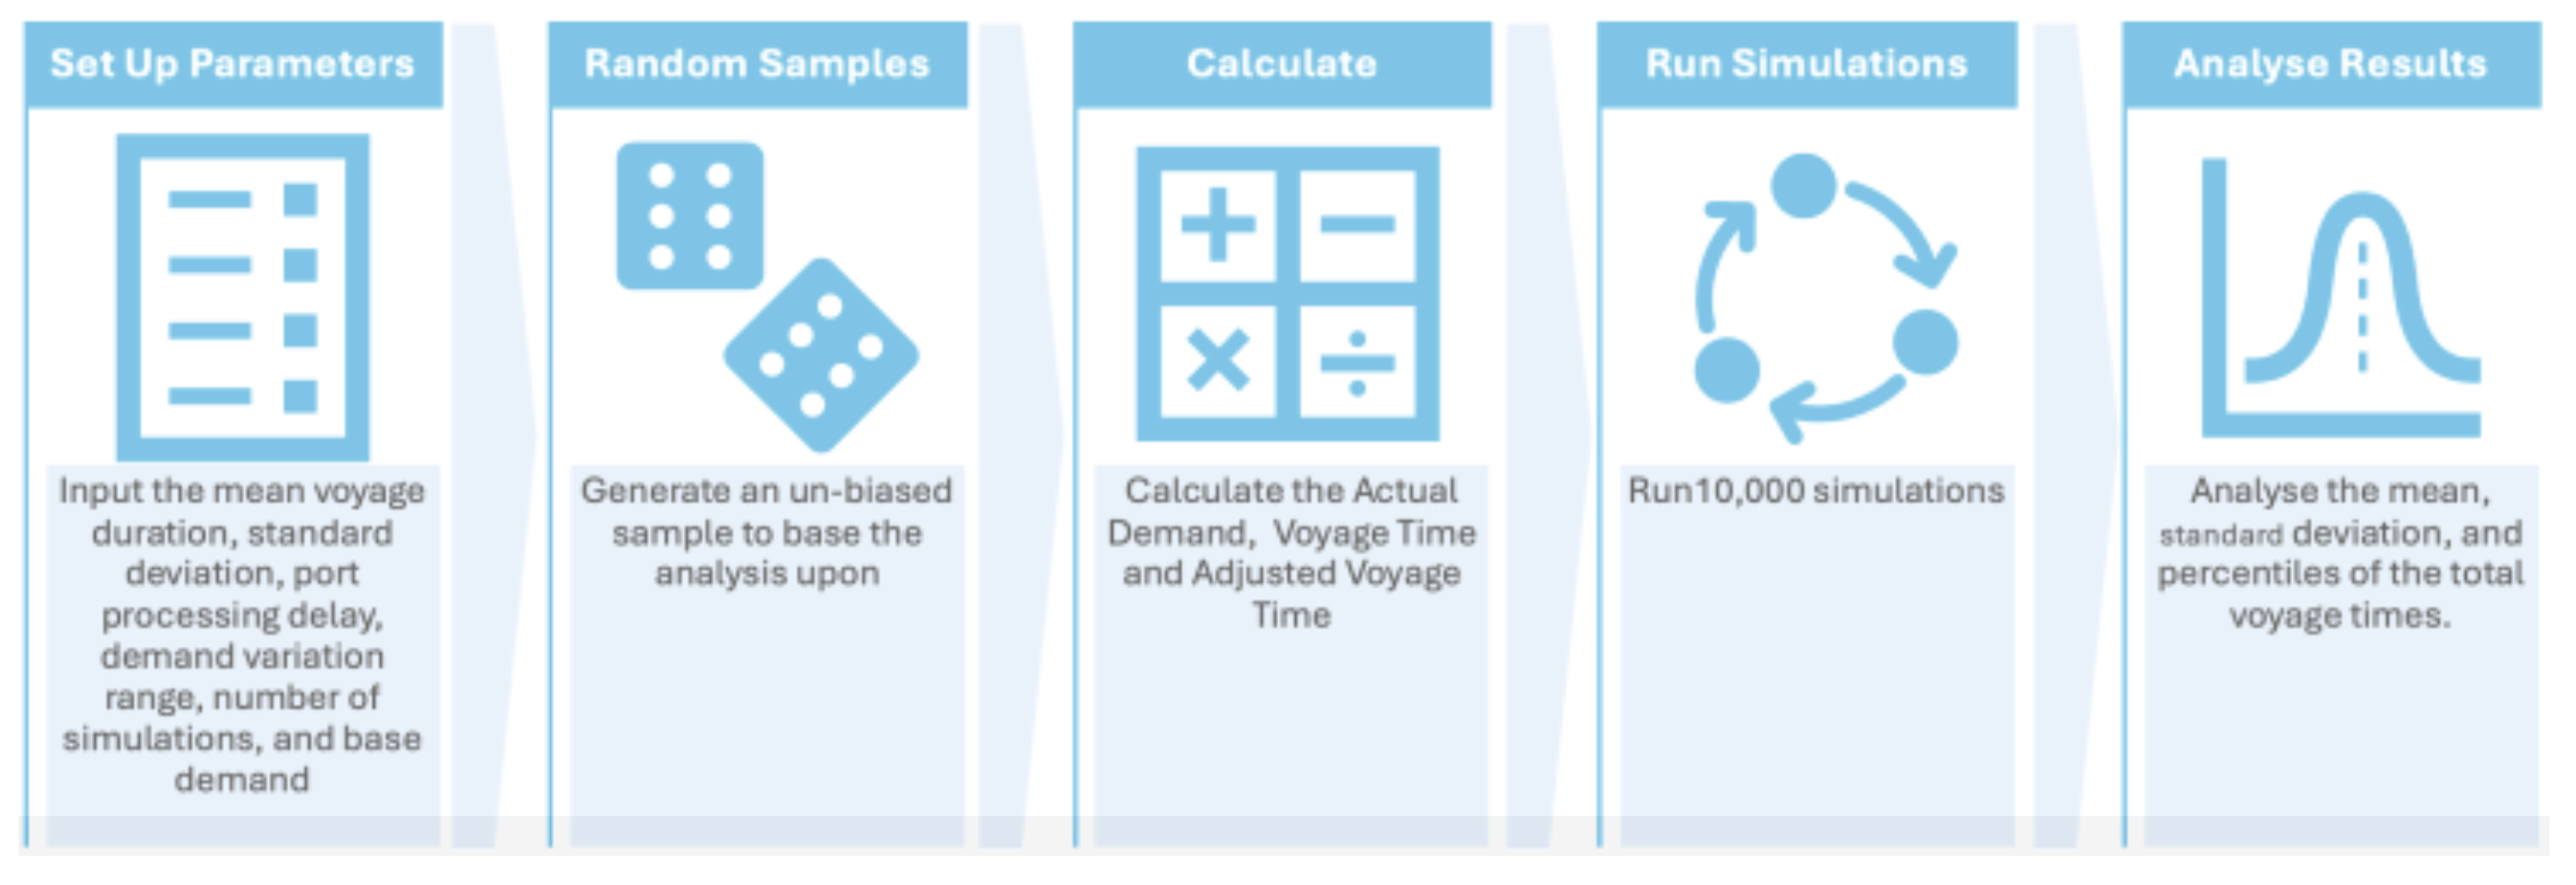
To build a Monte Carlo model for LNG vessel scheduling we follow these steps:
- Set Up Parameters: Input the mean voyage duration, standard deviation, port processing delay, demand variation range, number of simulations, and base demand.
- Generate Random Samples: Create random samples for voyage duration, port delays, and demand variation.
- Run Simulations: Run 10,000 simulations.
- Analyse Results: Calculate the mean, standard deviation, and percentiles of the total voyage times.
Parameters for the Simulation
In this example analysis, we have used the following parameters to model LNG vessel scheduling. These parameters provide a realistic framework for the simulation, capturing the inherent uncertainties in voyage durations, port delays, and fluctuating market demand:
- Mean Voyage Duration: 20 days
- Standard Deviation of Voyage Duration: 2 days
- Mean Port Processing Delay: 2 days
- Min Demand Variation: 80%
- Max Demand Variation: 120%
- Number of Simulations: 10,000
- Base Demand Index: 1,000
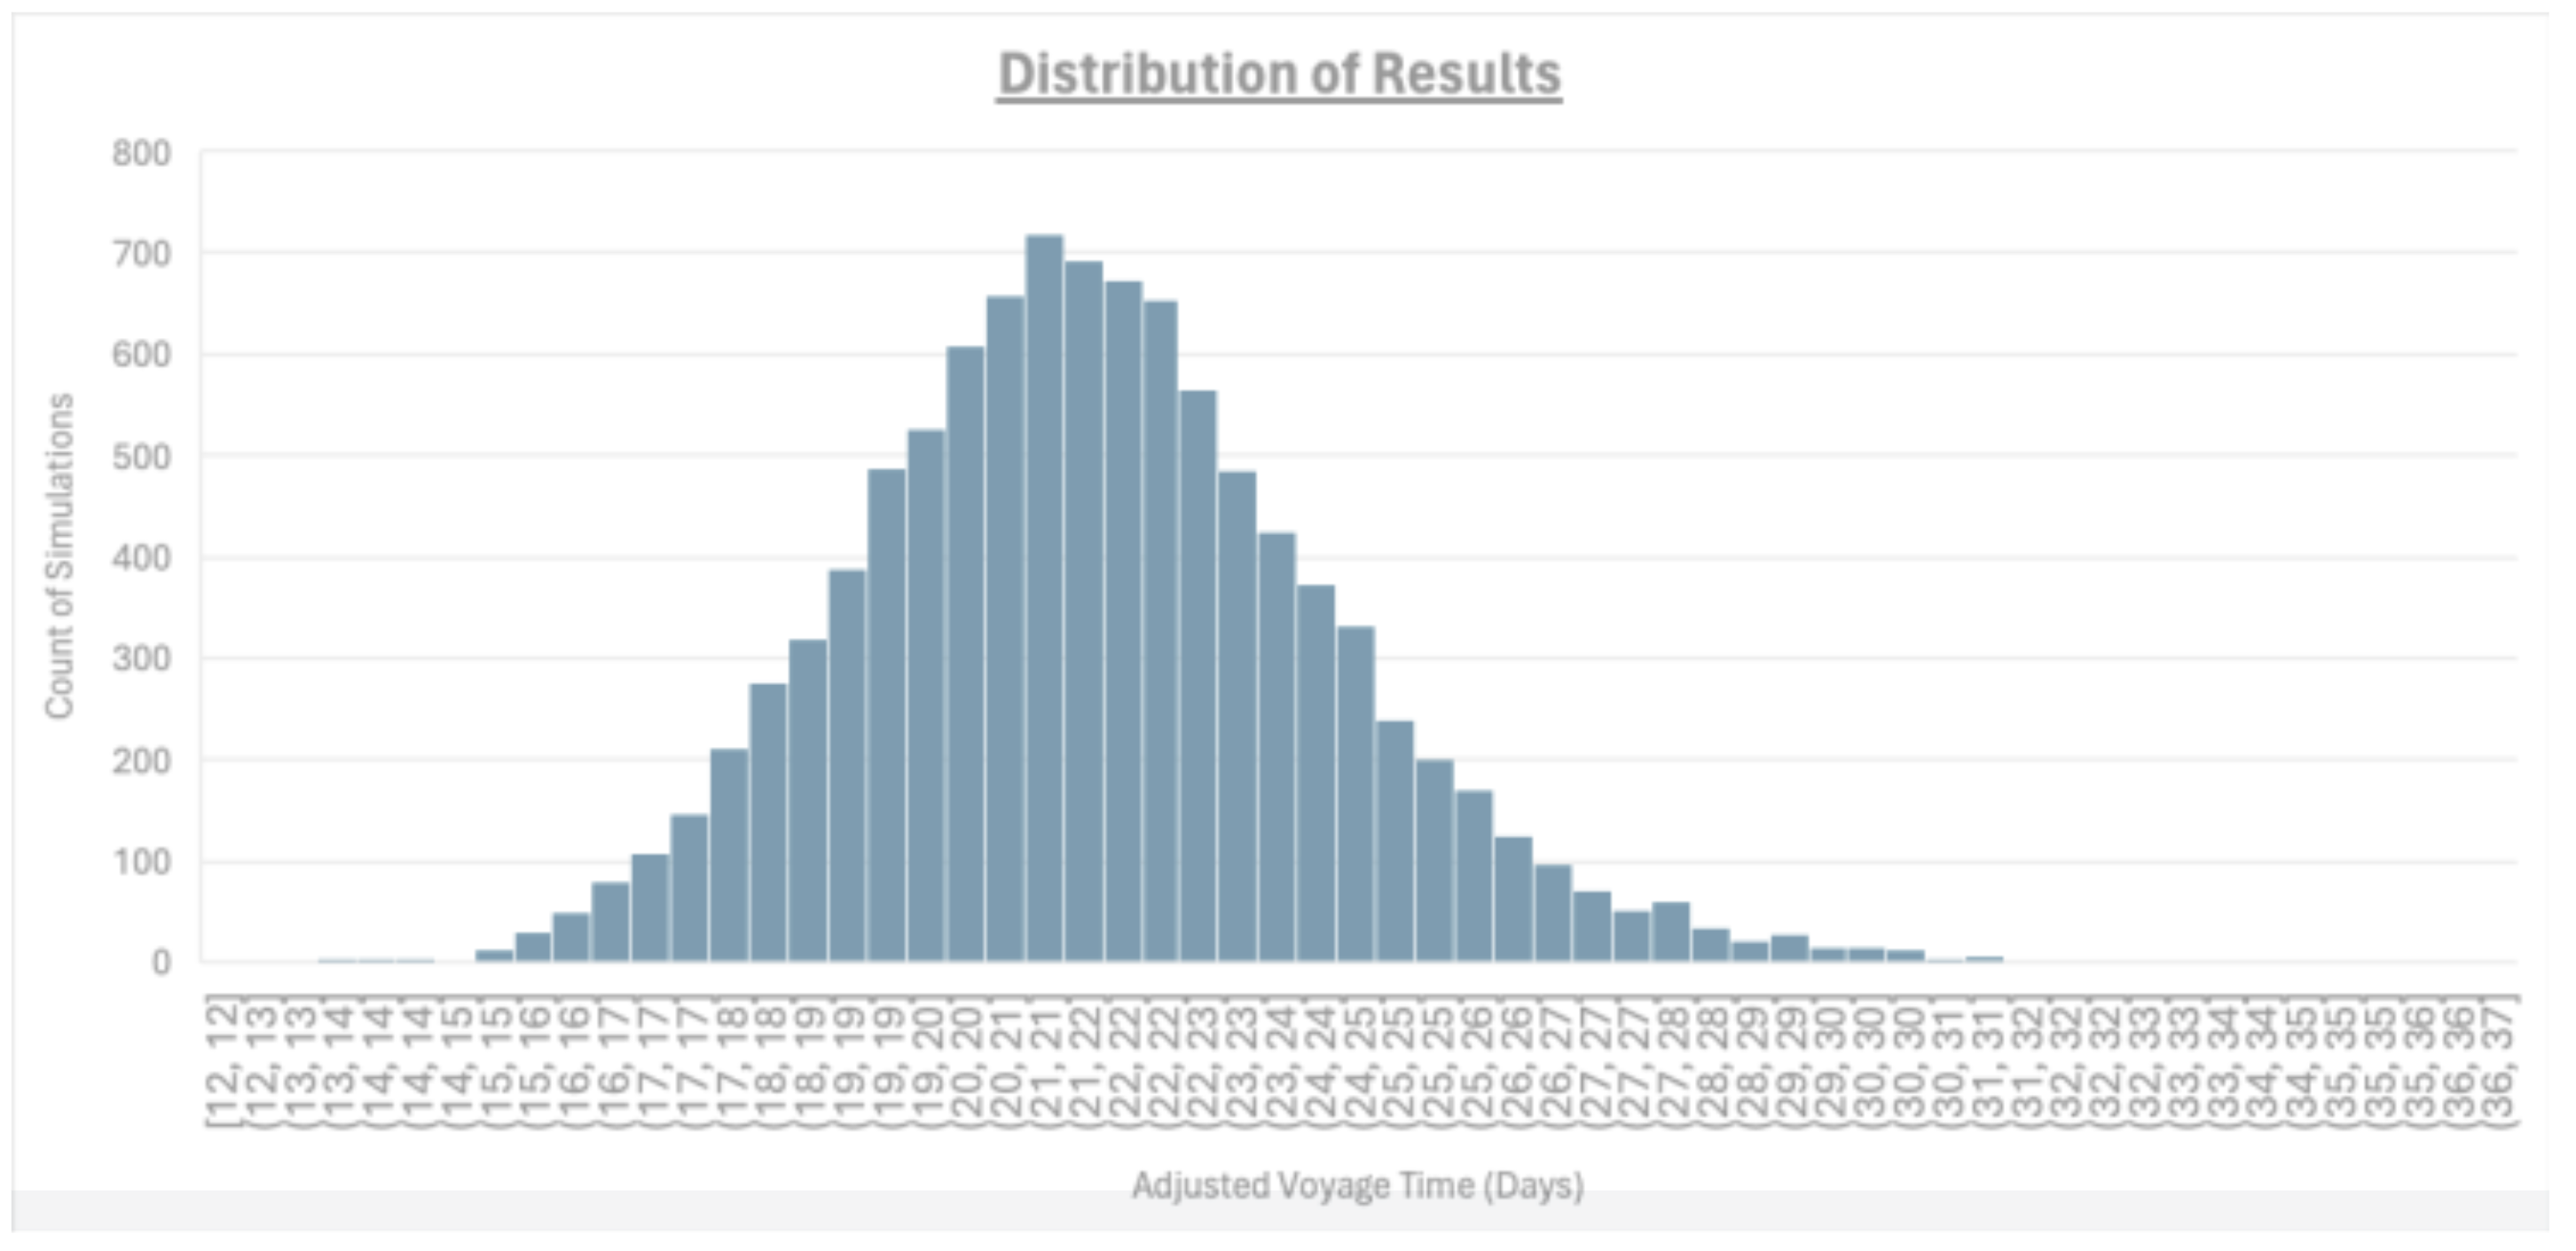
Key Simulation Results
The Monte Carlo simulation generated results, which offer valuable insights into the performance and reliability of the scheduling model, helping operators make informed decisions. Here are the following key results:
- Mean Total Voyage Time: 21.50 days
- Standard Deviation of Total Voyage Time: 2.51 days
- 90th Percentile: 24.74 days
- 95th Percentile: 25.88 days
Incorporating Demand Variation
Demand variation is a critical factor in LNG vessel scheduling, as it reflects the fluctuations in customer demand over time. In our model, demand can vary between 80% and 120% of the base demand of 1,000 ‘units’ (index). This range captures the uncertainty in market conditions and helps in adjusting schedules dynamically.
Impact on Scheduling of Higher Demand (Closer to 120%)
- Prioritisation: When the actual demand is higher, the model prioritises these shipments to ensure timely delivery. This might involve reducing buffer times or rescheduling less critical shipments
- Resource Allocation: More vessels may be deployed, and existing vessels may be scheduled more tightly to meet the increased demand.
Impact on Scheduling of Lower Demand (Closer to 80%)
- Flexibility: When demand is lower, there is less urgency in shipments. The model can afford to deprioritise these shipments, allowing for more flexibility and optimising resource use.
- Cost Efficiency: Operators can avoid over-supply and reduce operational costs by aligning vessel schedules with lower demand periods.
Understanding the Results
Mean Total Voyage Time (21.50 days)
The mean total voyage time is a crucial metric that represents the average duration of a voyage, including travel and port processing delays. This value serves as a baseline for planning and scheduling, providing an estimate of the typical time required to complete a trip.
Business Implication: By knowing that the average voyage takes approximately 21.5 days, LNG operators can set realistic schedules and manage customer expectations effectively. This also helps in resource allocation, ensuring that vessels and crews are utilised efficiently.
Standard Deviation of Total Voyage Time (2.51 days)
The standard deviation indicates the variability or dispersion of voyage times around the mean. A standard deviation of 2.51 days suggests moderate variability in the total voyage times, highlighting the presence of factors that can cause trips to be longer or shorter than the average.
Business Implication: Understanding the variability in voyage times is essential for risk management. Operators can prepare for potential delays by incorporating buffer times into the schedule. This helps in minimising disruptions and ensuring that delivery timelines are met consistently.
90th and 95th Percentiles
These percentiles are useful for understanding the upper bounds of voyage durations, providing a near-worst-case scenario that helps in robust planning.
90th Percentile (24.74 days): This value means that 90% of the voyages will be completed in less than 24.74 days.
95th Percentile (25.88 days): This value indicates that 95% of the voyages will be completed in less than 25.88 days.
-
- Business Implication: By planning for the 90th and 95th percentiles, LNG operators can ensure high reliability in their scheduling. This reduces the risk of significant delays and helps in maintaining customer satisfaction. These percentiles also guide contingency planning, ensuring that the supply chain remains resilient even in less favourable conditions.
Practical Implementation of Monte Carlo Simulation
To build a Monte Carlo model for LNG vessel scheduling we follow these steps:
- Set Up Parameters: Input the mean voyage duration, standard deviation, port processing delay, demand variation range, number of simulations, and base demand.
- Generate Random Samples: Create random samples for voyage duration, port delays, and demand variation.
- Run Simulations: Run 10,000 simulations.
- Analyse Results: Calculate the mean, standard deviation, and percentiles of the total voyage times.
Conclusion
The Monte Carlo simulation model provides valuable insights into LNG vessel scheduling, helping operators make informed decisions. By incorporating demand variation, voyage durations, and port delays, the model captures some of the complexities of the LNG supply chain. This leads to improved scheduling accuracy, enhanced resource utilisation, effective risk management, and high customer satisfaction.
In a dynamic and uncertain market, such a comprehensive model is essential for maintaining the efficiency and reliability of LNG logistics.